The numbers, with the math still attached
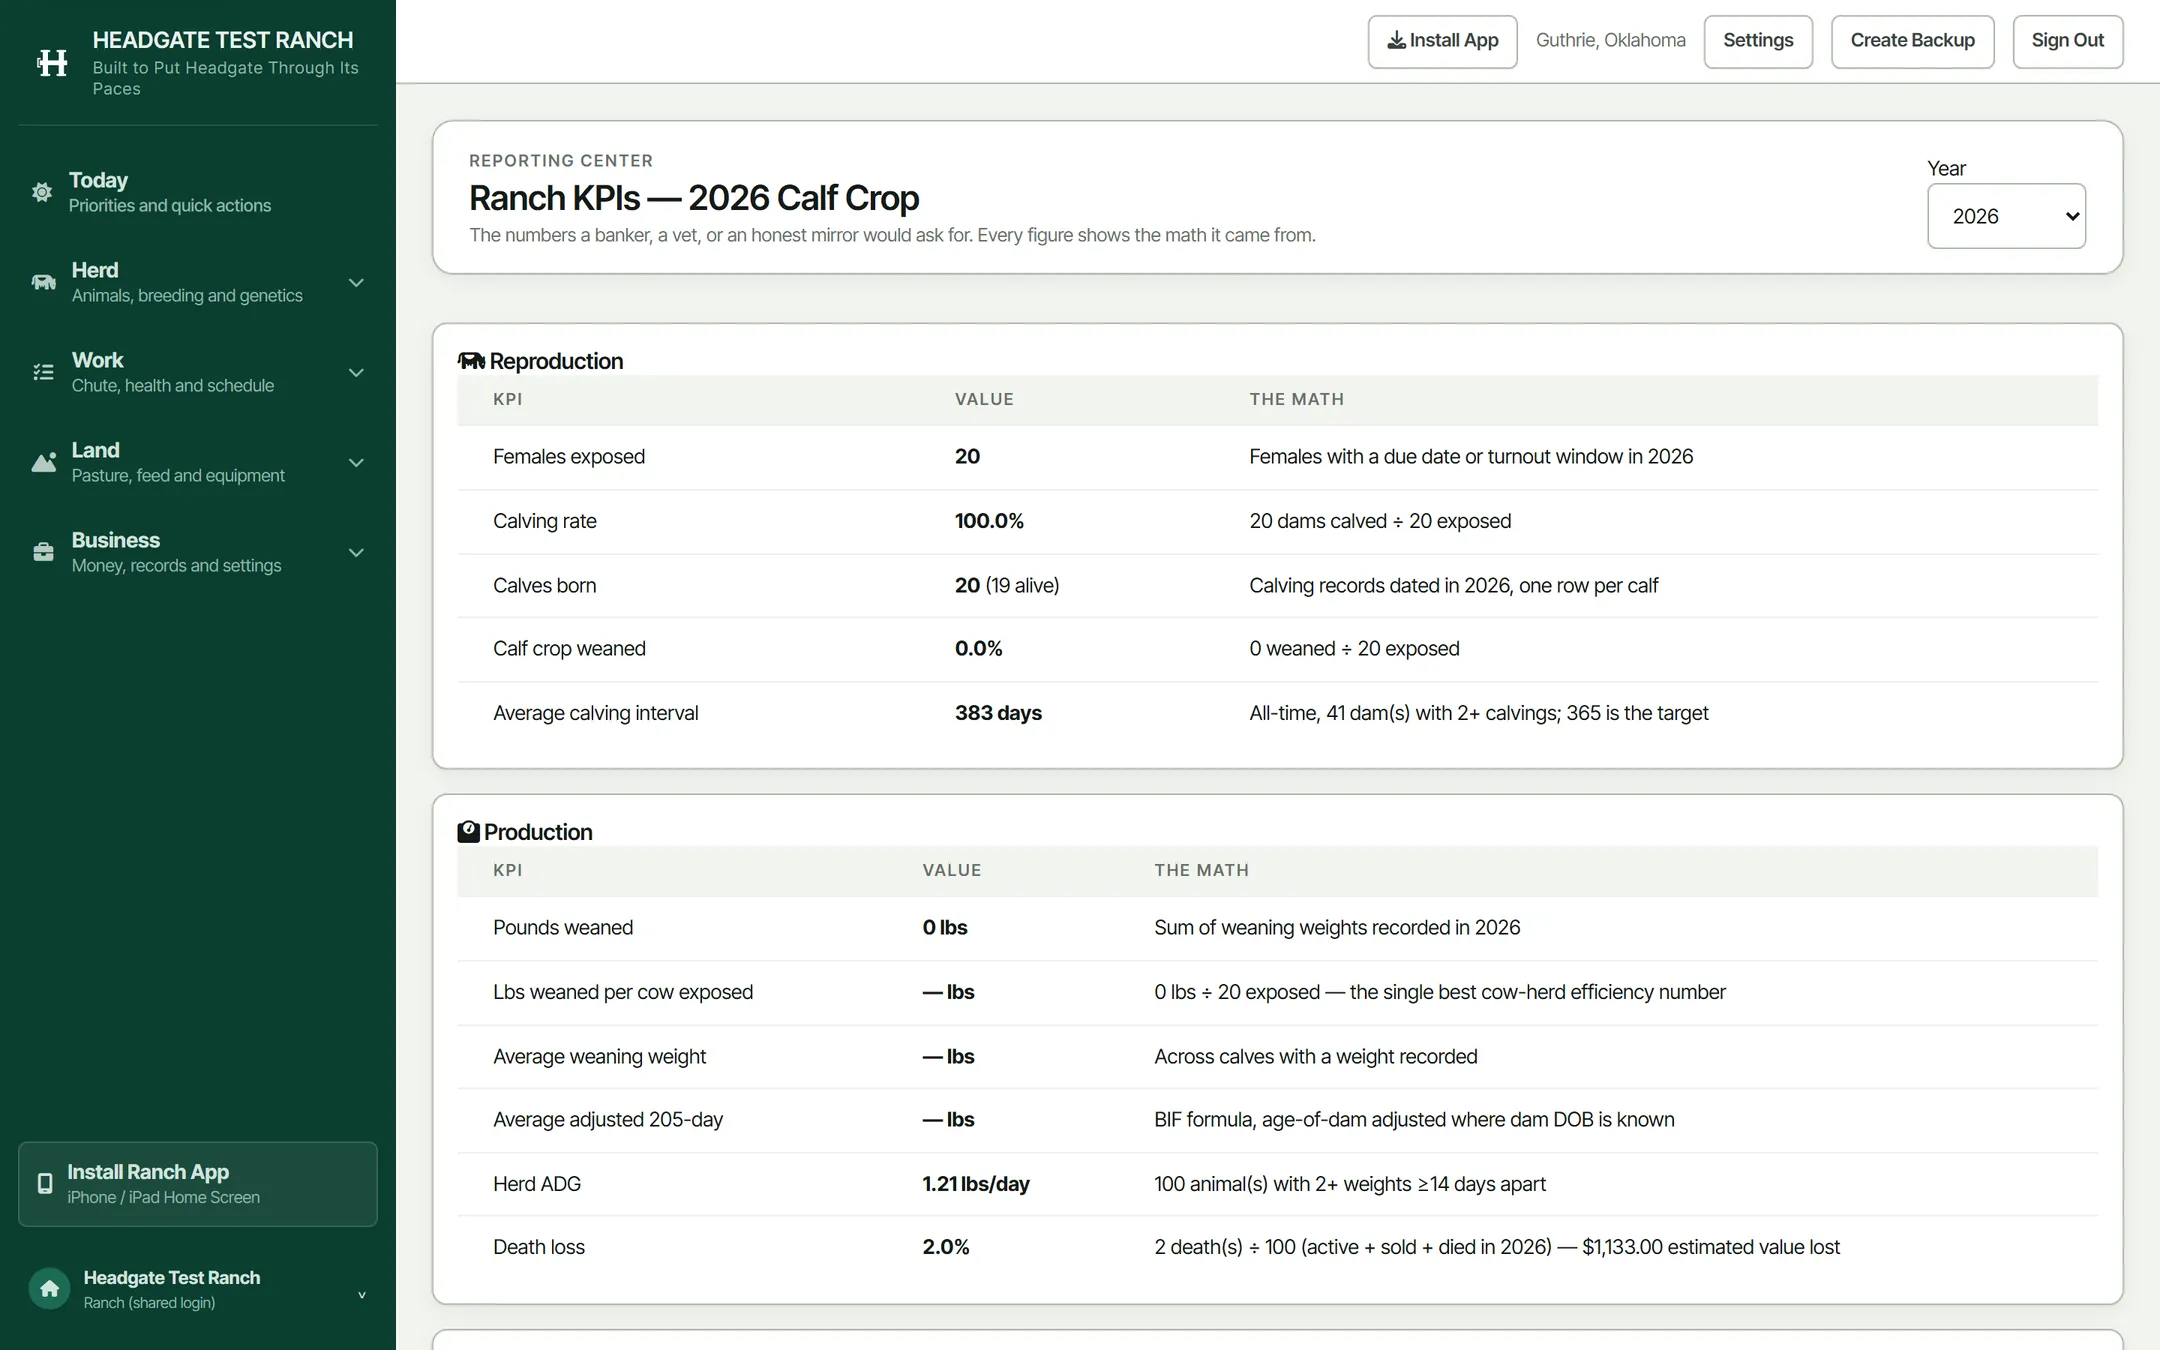
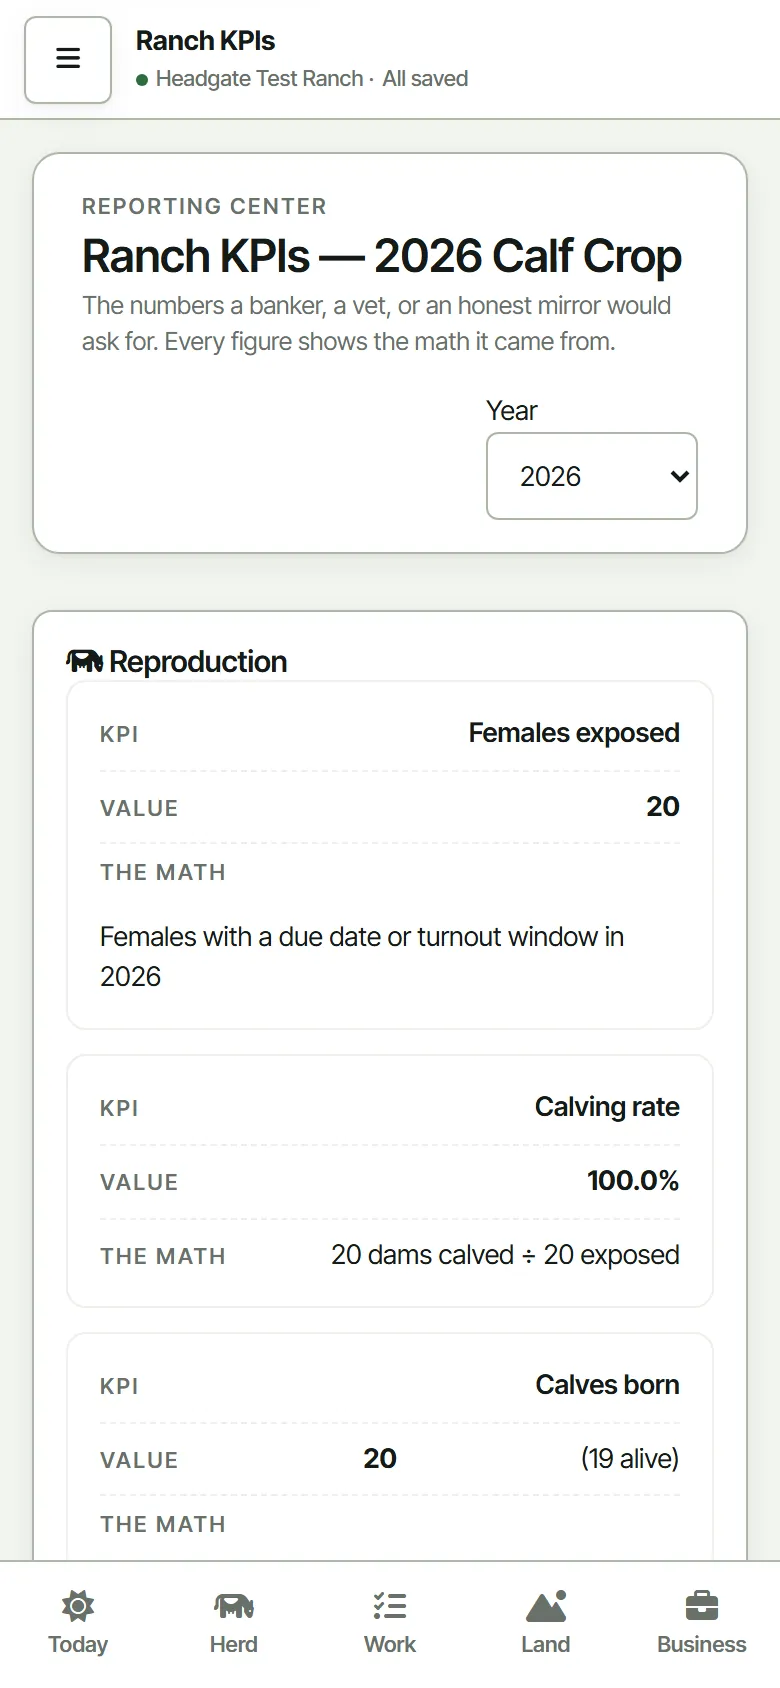
Every figure on the KPI report shows what it was divided by. A number you cannot check is a number you cannot take to the bank.
Pick a year, not a window
Calf crops are years. The report runs on one, and the years you have records for are the years it offers. Reproduction, growth, death loss and the herd inventory all resolve against that same year, so nothing on the page is counting a different set of cattle to the row above it.
Everything comes out as a CSV
Herd, health, weights, weaning, calving, deaths, purchases, finance, working sessions, and a Schedule F summary. If your accountant wants a spreadsheet, they get a spreadsheet rather than a screenshot of one.
Nothing is smoothed
Calf crop weaned reads 0.0% here because this ranch has not weaned this year's calves yet. The report says the zero rather than hiding the row, because a blank is how a number goes missing for a season.
What each head cost.
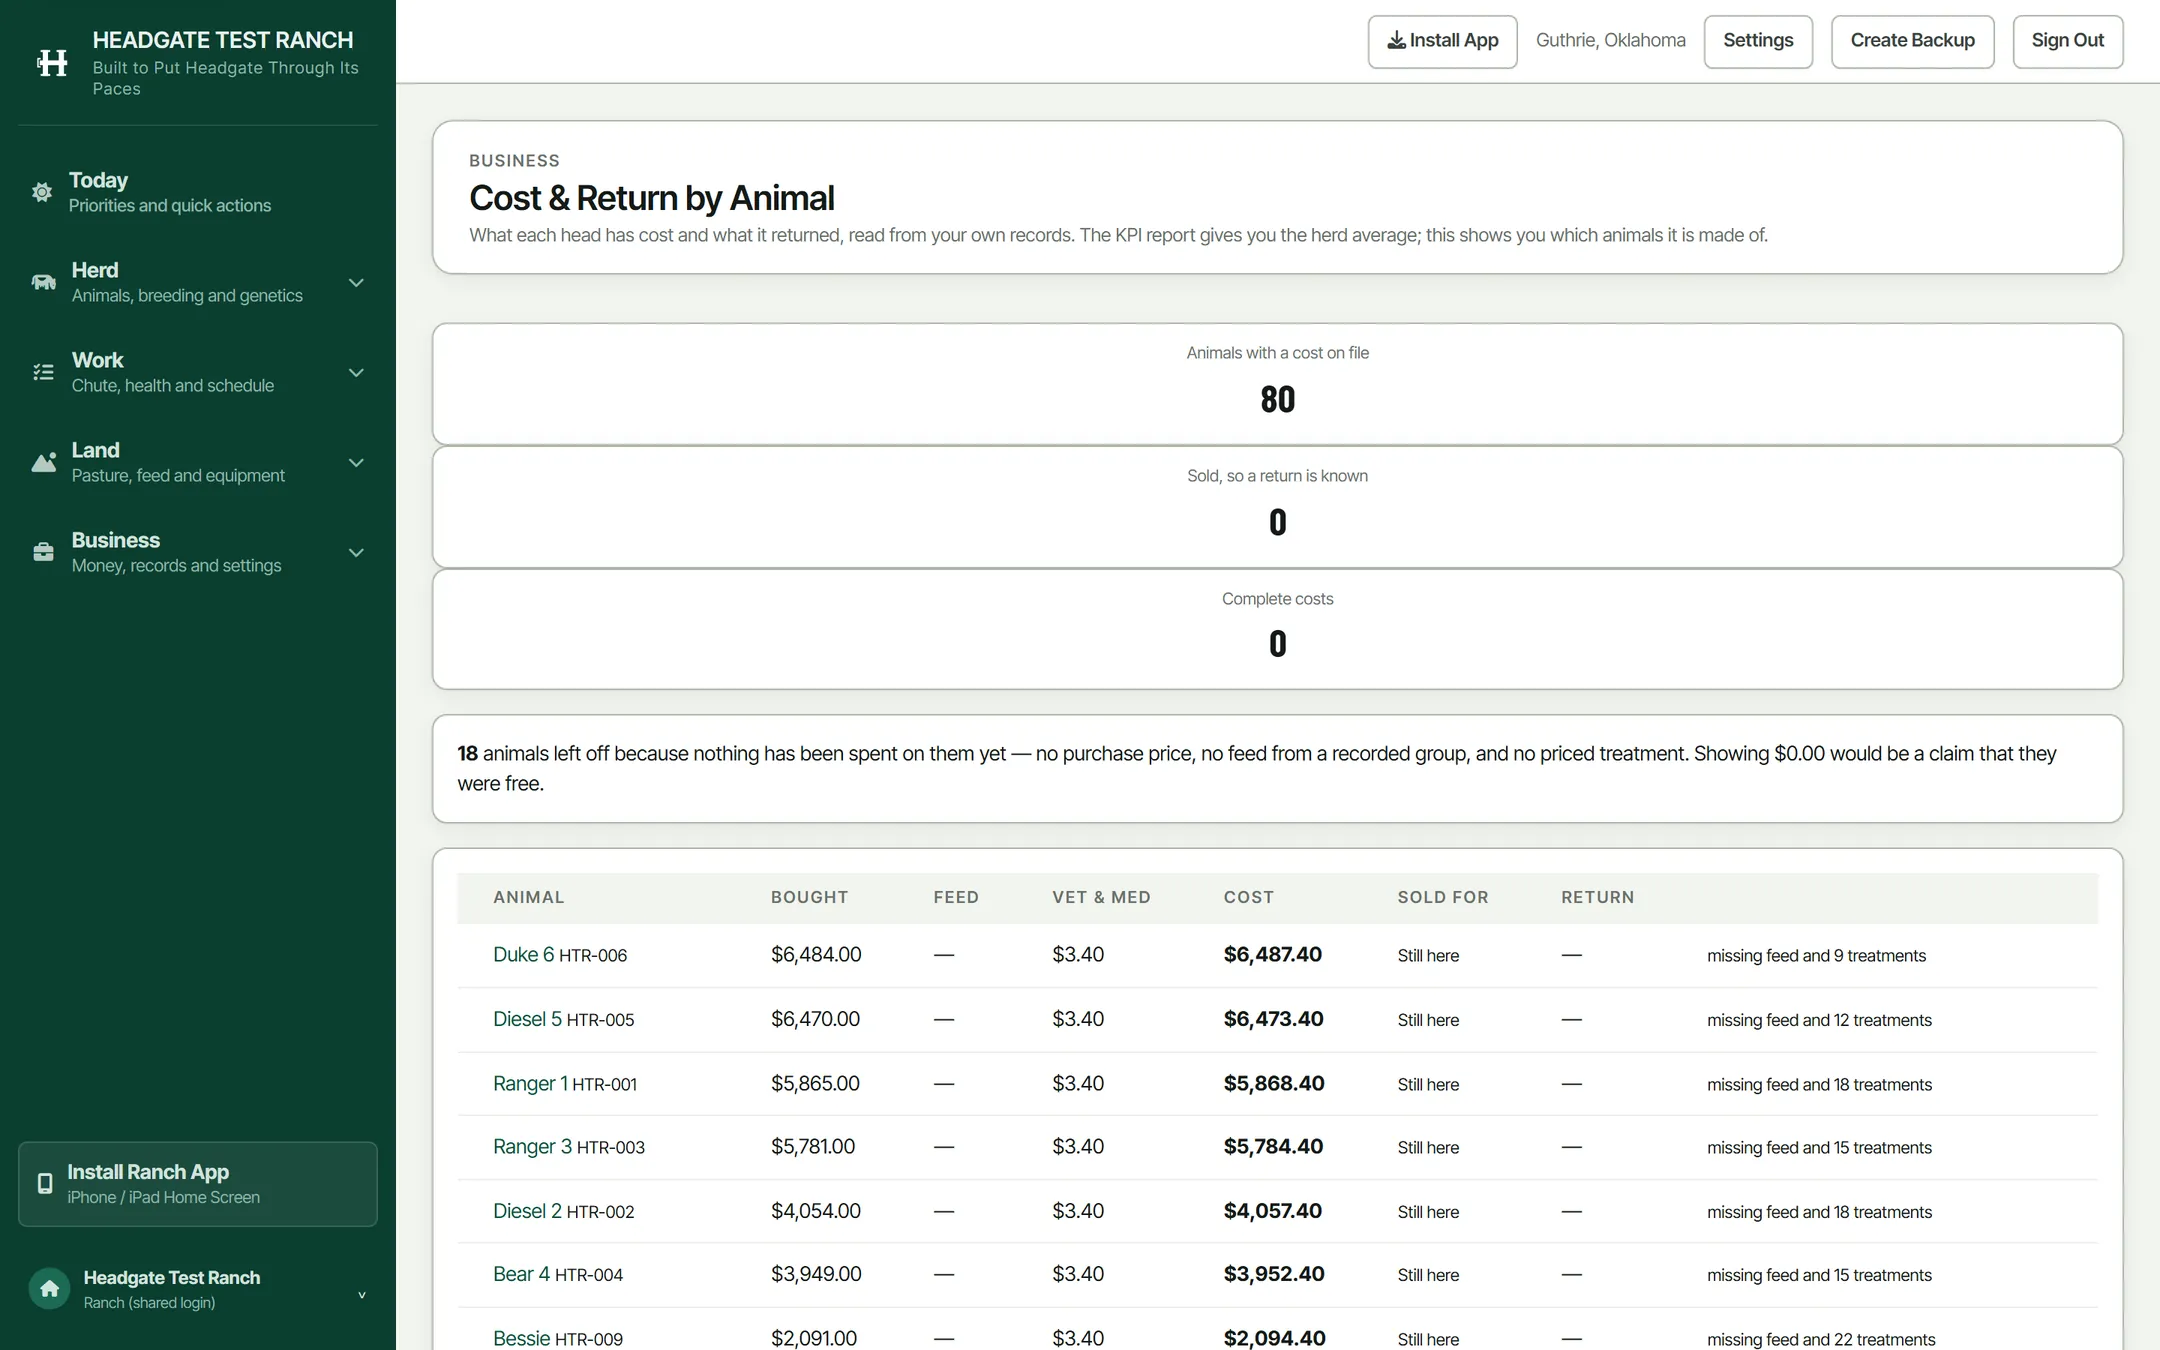
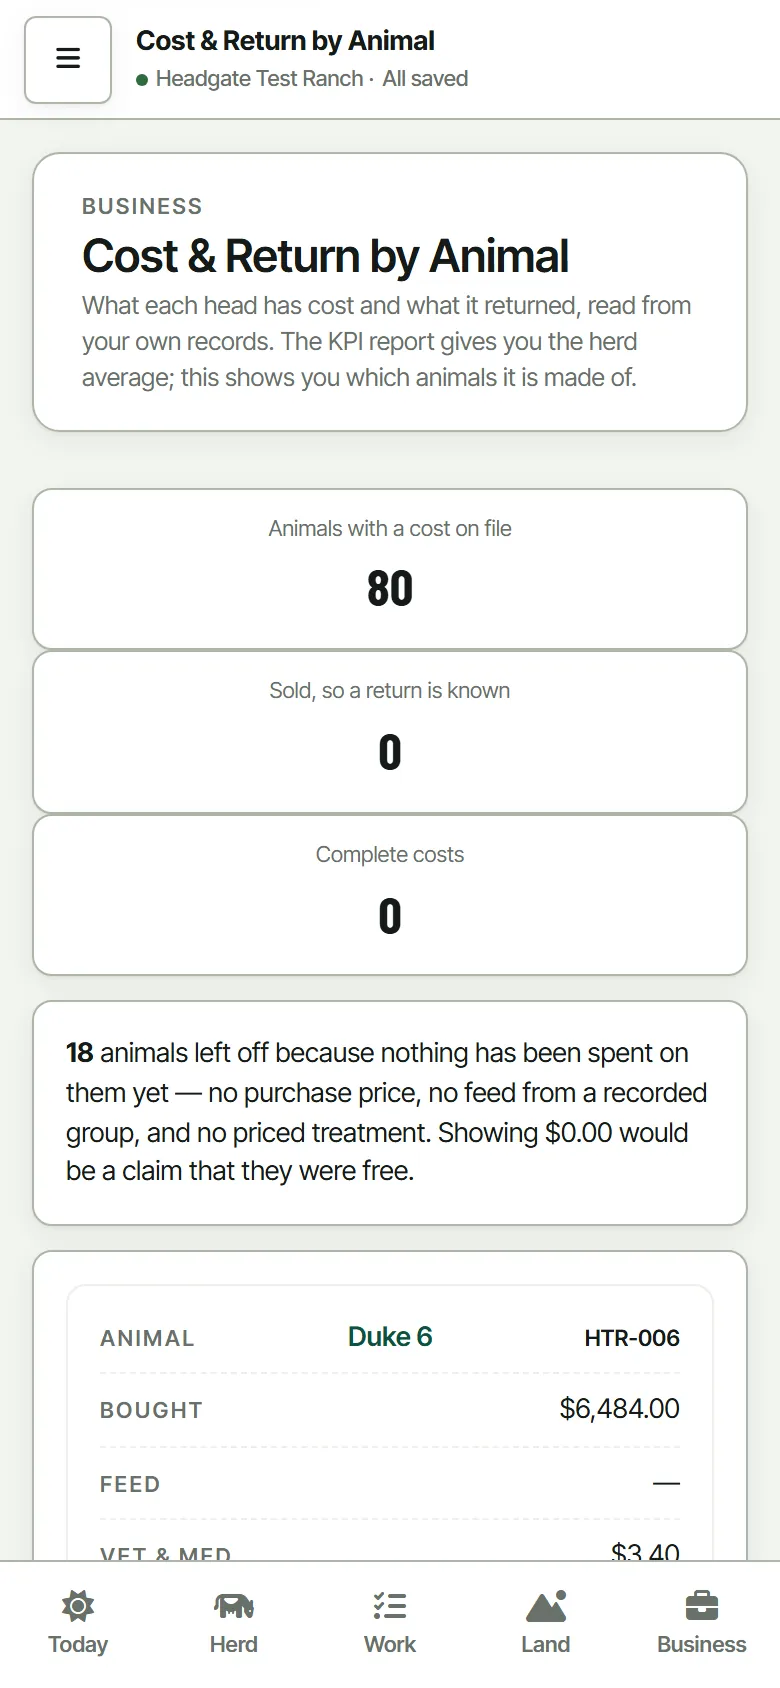
The KPI report gives you the herd average. This shows you which animals that average is made of.
Built out of records you already keep
Purchase price off the animal, feed off the group it was fed in, vet and medicine off the treatments actually given to it. No new screen to fill in, and no allocation rule you have to trust without seeing.
It refuses to show a free cow
Eighteen head are left off this report entirely, because nothing has been spent on them yet: no purchase price, no priced feed, no priced treatment. Printing $0.00 against them would be a claim that they were free, and they were not.